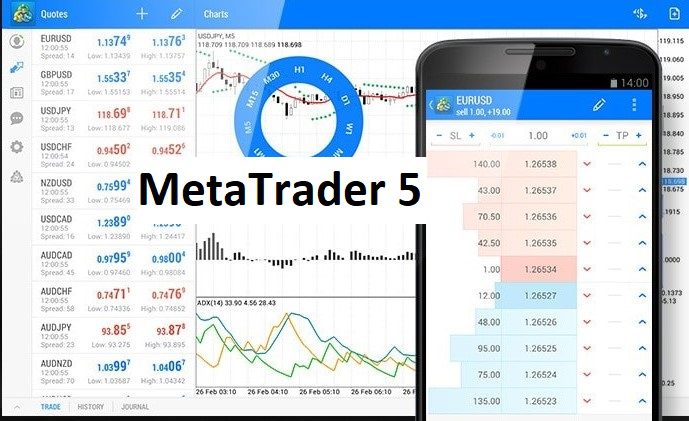
As a trader of forex, commodities, and stocks, you need to have a grasp of MetaTrader 5 indicators, which would help you identify the right time to enter or exit a market.
Apart from knowing when to enter and exit, MT5 indicators will also help you to provide insights into market trends, give you insight into trading opportunities, and analyse market data.
If you want to understand the market behaviour, here are the indicators you should know:
Volume
The number of price movements within a period is indicated by volume. A green bar represents the current bar’s volume exceeding the previous one, while a red bar signifies a smaller volume of trade than the previous one.
On Balance Volume (OBV)
This indicator relates volume to the price change of a security. If the security price is greater than the OBV movement, it indicates a bull market. A bearish market is suggested if it is lower than the security price.
Envelopes
Two Moving Averages make an Envelope: one shifting upward and the other shifting downward. This shows you the lower and upper margins of a security’s price range.
Trend Indicators
These are used to identify trends in the markets and would help you to forecast future prices. These would help in guiding your trading decision. You wouldn’t like to jump into the market without knowing the trends.
Standard Deviation
This simply means how volatile the market is about security. The standard deviation shows the price movement fluctuations. The market is volatile when the value is high.
Moving Average
This indicates the mean price value of the security in a specific time. So, the moving average indicator is time-specific.
Oscillator indicators
The oscillator indicators mean the price deviation of the security from its average price value. It helps traders to predict potential trend direction in the market.
Average True Range (ATR)
ATR indicator shows the market’s volatility. A higher Average True Range value could mean that a trend reversal is in the offing.
Momentum
The Momentum indicator is used for measuring the price changes of a security over a certain period. It can be used in confluence with the Moving Average Convergence Divergence. A trader will use the momentum indicator to know when to buy and when to sell. When the signal increases, that’s a buy and it’s a sell, when it decreases.
Bollinger Bands
Bollinger Bands indicate the market price volatility of a security over a period. The bands widen during high market volatility and contract during low volatility.
DeMarker
The DeMarker indicator compares the current period’s maximum price with the previous period’s maximum price. When the indicator falls below 30, it signals a bullish reversal trend. If it exceeds 70, it signals a bearish reversal trend.
Volume indicators
Volume indicators measure the trade volume, which can refer to the number of trades executed in a specific period or the number of price movements in a particular time interval.
Williams Alligator
Williams Alligator indicator uses three Moving Averages of 5, 8 and 13 periods. This identifies sudden trends using smoothed Moving Averages.
Commodity Channel Index (CCI)
The Commodity Channel Index (CCI) measures how much the commodity price deviates from its average price. When the commodity price is higher than the average price, it signals a high price. Conversely, it signals a low price when the commodity price is below the average.
Gator Oscillator
Gator Oscillator helps us understand how the market is moving. It shows us if the market is coming together or moving apart. Imagine you have two lines, one red and one green, that represent different averages in the market.
The Gator looks at how far apart these lines are and plots it on a histogram. When the red bars on the histogram are getting smaller, it means the market is slowing down. But if the green bars are getting bigger, it shows that the market is getting stronger.
So, basically, the Gator helps us see if the market is getting more stable or more volatile. It gives us a visual way to understand these changes.
Average Directional Movement Index (ADX)
The Average Directional Movement Index indicator identifies an existing price trend over a period and eliminates false signals to ensure that only significant price movements are considered.
Accumulation and Distribution (A/D)
A/D indicator is calculated through the changes in volume and prices of a security. When it increases in value, it sends a buy signal and vice versa.
Money Flow Index (MFI)
The Money Flow Index measures the buying and selling pressure of an asset through price and volume. It also tracks the flow of money in and out of an asset over a certain period.
Awesome Oscillator
This indicator measures the market momentum with a 34-period Moving Average. It is a buy signal when histogram is above zero, conversely, it is a sell signal when the histogram is below zero.
Williams Percent Range (Williams %R)
Williams Percent Range identifies if an asset is overbought or oversold. It indicates an oversold market when it shows a value between 80% to 100%. It shows an overbought market when the values are between 0% to 20%.
Fractals
A fractal helps detect the market’s highest and lowest price movements. Five bars make up an upwards fractal, with two bars before and after the market’s highest maximum point. The lowest low is defined by the bar that is the lowest in the middle, flanked by two higher lows on either side.
Market Facilitation Index
The Market Facilitation Index indicator illustrates the fluctuations in prices of a security. When it aligns with the volume, it signifies an acceleration in price movements. Conversely, when they diverge, it implies a state of indecision between buyers and sellers.


